

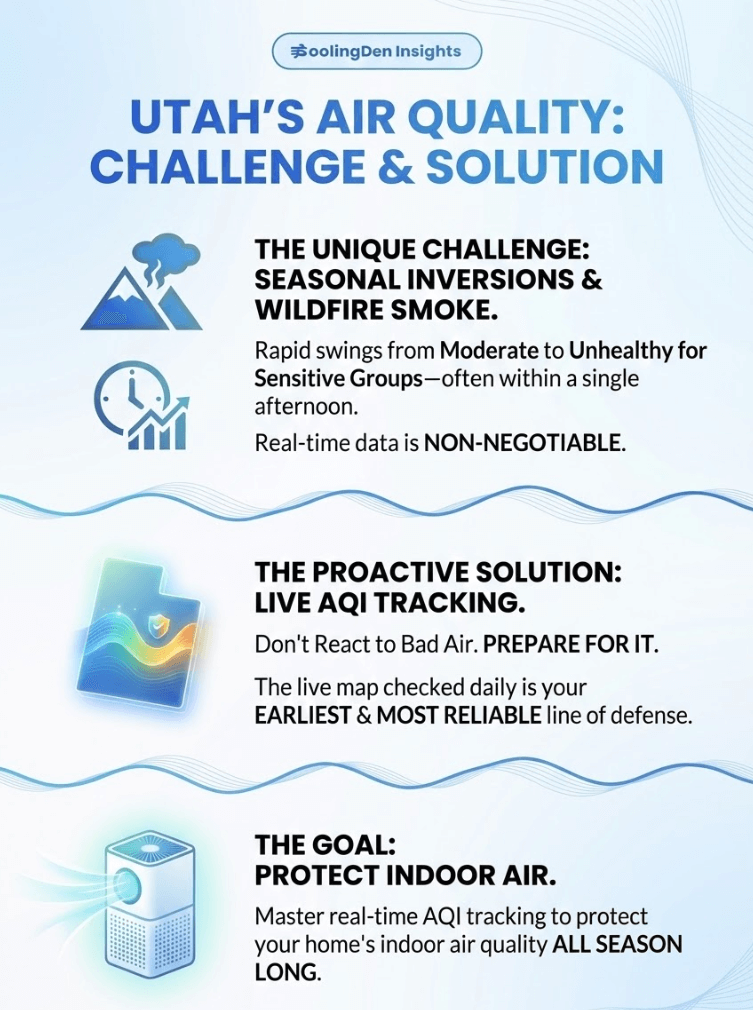
At CoolingDen, we work with homeowners every day on indoor air quality, and one pattern is consistent: people react to bad air rather than prepare for it. Utah’s seasonal inversions and wildfire smoke events make real-time AQI data non-negotiable, not optional. We’ve seen how fast Salt Lake Valley conditions can swing from moderate to “Unhealthy for Sensitive Groups” — often within a single afternoon.
This live map gives you current Air Quality Index readings across Utah, updated in real time. Use it to decide when to open windows, limit outdoor activity, or run your home’s air filtration system. Because in our experience, the homeowners who check first breathe better all season long.
TL;DR Quick Answers
Live Air Quality Index AQI Map Now Today Utah
Utah’s live AQI map updates in real time from monitoring stations across Salt Lake City, Provo, Ogden, St. George, and the Wasatch Front.
Check today’s Utah AQI at:
- Utah DEQ Live Map: air.utah.gov
- EPA AirNow Utah: airnow.gov/state/?name=utah
Today’s AQI at a glance:
- 0–50: Good — safe for everyone
- 51–100: Moderate — sensitive groups take caution
- 101–150: Unhealthy for Sensitive Groups — close windows, check filter
- 151–200: Unhealthy — run home air filtration now
- 201–300: Very Unhealthy — stay indoors, seal gaps
- 301+: Hazardous — avoid all outdoor exposure
What drives Utah’s AQI today:
- Winter inversions trap PM2.5 at ground level along the Wasatch Front
- Wildfire smoke from regional fires can spike AQI within hours
- Storm systems are the primary mechanism that clears poor air conditions
What to do right now based on today’s AQI:
- Check the live map before opening windows or going outdoors
- Run a MERV 11 or higher-rated filter if AQI is Orange or above
- Keep windows closed and exhaust fans off on Red days or higher
- Sign up for Utah DEQ alerts at air.utah.gov to get conditions pushed directly to you
From our field experience: Utah’s AQI can shift from acceptable to Unhealthy before most residents notice. The live map checked daily is the earliest and most reliable line of defense a Utah household has.
Top Takeaways: What Every Utah Resident Should Know About Air Quality Today
- Check Utah’s live AQI map daily — it’s the single most actionable habit you can build.
- Ozone is invisible and odorless
- Winter inversions build before most residents notice
- The map tells you what’s coming before your body does
- Being indoors on a high-AQI day does not automatically mean being protected.
- Fine particulate matter infiltrates through gaps, ventilation, and poorly maintained ductwork
- A clogged or low-rated filter offers far less protection than most Utah families assume
- During a five-day inversion stretch, that gap compounds every hour
- Utah’s air quality challenge is year-round — not seasonal.
- Winter inversions dominate the cold months
- Wildfire smoke covers summer and fall
- Together, they make AQI awareness a daily discipline, not a weather event response
- The research is more serious than most residents realize.
- 9th worst in the nation for ozone pollution — two years running
- Up to 8,000 estimated premature deaths in Utah annually
- 75% of Utahns may lose at least one year of life due to air pollution
- These are not outlier statistics — they reflect documented Wasatch Front reality
- The most effective Utah households share consistent habits — not sophisticated equipment.
- Check the AQI map daily
- Run a MERV 11 or higher-rated filter
- Replace filters on a consistent schedule
- Act before inversion conditions lock in — not after
Table of Contents
What the Utah AQI Map Shows You Right Now
This live map pulls real-time Air Quality Index data from monitoring stations across Utah — Salt Lake City, Provo, Ogden, St. George, and surrounding communities. Each color-coded zone reflects current pollution levels measured in micrograms per cubic meter, updated continuously throughout the day.
AQI at a glance:
- 0–50 (Green): Good — outdoor activity is safe
- 51–100 (Yellow): Moderate — sensitive individuals should take caution
- 101–150 (Orange): Unhealthy for Sensitive Groups — limit prolonged outdoor exposure
- 151–200 (Red): Unhealthy — everyone should reduce outdoor activity
- 201–300 (Purple): Very Unhealthy — stay indoors when possible
- 301+ (Maroon): Hazardous — avoid all outdoor exposure
Why Utah Air Quality Fluctuates So Dramatically
Utah’s geography is the core problem. The Wasatch Mountains and surrounding basin topography create ideal conditions for temperature inversions — a phenomenon where cold air gets trapped beneath a warm air layer, locking in vehicle exhaust, industrial emissions, and fine particulate matter (PM2.5) at ground level.
In our experience working with homeowners on indoor air quality, the days that catch people off guard aren’t the obvious wildfire smoke days — it’s the quiet winter inversion days when the AQI climbs past 150 before noon and nobody checked.
Utah’s primary AQI drivers:
- Winter temperature inversions along the Wasatch Front
- Wildfire smoke from in-state and neighboring wildfires (June–October)
- Vehicle emissions concentrated in valley communities
- Industrial and refinery output near Salt Lake and Utah counties
- Dust and particulate events in southern Utah’s desert regions
Which Utah Cities Are Most at Risk?
Salt Lake City, Murray, West Valley City, and Provo consistently record the highest AQI readings during inversion season due to their position in the Salt Lake Valley basin. St. George and Cedar City face elevated particulate events driven by regional dust and wildfire smoke.
Communities at higher elevations — Park City, for example — typically experience cleaner air during inversions, while valley residents bear the brunt of trapped pollutants.
How to Use Today’s Utah AQI Reading to Protect Your Health
Checking the number is only half the equation. Acting on it is what reduces your exposure.
Based on current AQI, here’s what we recommend:
- Green or Yellow: Windows open, outdoor exercise is fine
- Orange: Close windows, reduce strenuous outdoor activity for children and seniors
- Red or above: Run your home’s air filtration system, keep windows closed, limit time outdoors for everyone
- Purple or Maroon: Treat this like a weather emergency — stay indoors, seal gaps around doors and windows, and run HEPA-rated filtration continuously
One thing we’ve consistently seen: homeowners without a functioning air filtration system feel the health effects of bad air days far longer than those who have one running and properly maintained.
Indoor Air Quality on High-AQI Days in Utah
When outdoor AQI climbs, your home’s indoor air quality follows — unless your HVAC system and filtration are doing their job. On inversion days and wildfire smoke events, fine particulate matter (PM2.5) infiltrates through gaps, ventilation, and poorly sealed ductwork.
Steps to protect indoor air on high-AQI days:
- Run your HVAC system with a MERV 11 or higher-rated air filter in place
- Replace filters more frequently during inversion season and wildfire months
- Avoid activities that add indoor pollutants — candles, frying, gas stoves — when outdoor AQI is already elevated
- Keep exhaust fans off on high-AQI days — they pull contaminated outdoor air in
Staying ahead of Utah’s air quality swings starts with real-time data and a home that’s equipped to handle what the map is telling you.
“In our field experience helping Utah homeowners manage indoor air quality, the most dangerous AQI days aren’t the obvious ones — it’s the quiet winter inversion mornings when levels cross 150 before most families finish breakfast, and nobody thought to check.”
Essential Utah Air Quality Resources Every Resident Should Bookmark Today
At CoolingDen, we work with homeowners every day on indoor air quality — and here’s what we’ve learned firsthand: the residents who stay ahead of bad air days are the ones who know exactly where to look. We’ve identified the most reliable Utah AQI resources so you’re never guessing when conditions shift.
1. Utah DEQ Live Air Quality Map — The First Place We Tell Homeowners to Check Every Morning
This is the official state monitoring dashboard pulling live AQI data directly from Utah’s Air Monitoring Network — no third-party lag, no guesswork. In our experience, checking this map before opening windows or planning outdoor activity is one of the simplest habits that makes a real difference in how much pollution exposure your household absorbs on inversion days. 🔗https://air.utah.gov/map.htm
2. EPA AirNow Utah — Federal-Level AQI Alerts You Can Trust When Conditions Turn Serious
When AirNow posts a health advisory for your Utah community, it carries the weight of federal environmental standards — and in our field experience, those advisories are the clearest signal to shut windows, run your air filtration system, and keep sensitive family members indoors. This is the benchmark tool, and it updates throughout the day. 🔗https://www.airnow.gov/state/?name=utah
3. Utah DEQ Inversions Guide — Understand the Science Behind Utah’s Most Dangerous Air Quality Events
Utah averages five to six multi-day inversion episodes every winter, with roughly 18 days per year exceeding federal PM2.5 safety thresholds — and from what we’ve seen, most homeowners don’t realize how fast those levels climb once an inversion locks in. This DEQ resource explains exactly why Utah’s basin geography makes inversions so severe and what each episode means for your family’s daily exposure. 🔗https://deq.utah.gov/air-quality/inversions
4. IQAir Utah — Real-Time PM2.5 Data and AQI Forecasting When You Need to Plan a Day Ahead
IQAir delivers pollutant-specific breakdowns — PM2.5, ozone, NO2, CO — for Salt Lake City, Provo, Ogden, and surrounding Utah communities, with forecasting tools that let you plan outdoor activity before conditions deteriorate. We consistently point homeowners to IQAir’s forecast feature during wildfire season and winter inversion months, when next-day air quality can shift dramatically overnight. 🔗https://www.iqair.com/us/usa/utah
5. Utah Department of Health — How Utah’s Air Pollution Connects Directly to Your Health Outcomes
Particulate matter is Utah’s most dangerous winter pollutant, and prolonged inversion episodes regularly push PM2.5 levels beyond federal safety limits in ways that create real, measurable health risks for residents of every age. This state health resource is the one we recommend when homeowners want to understand not just what the AQI number means — but what it’s actually doing to their respiratory and cardiovascular health over time. 🔗https://health.utah.gov/utahair/background.html
6. HEAL Utah Clean Air Program — For Residents Who Want to Go Beyond Checking the Map and Take Action
HEAL Utah covers the full picture of what Utah residents are breathing — from winter inversions and wildfire smoke to dust events from the shrinking Great Salt Lake and the disproportionate air quality burdens carried by vulnerable communities statewide. If your household has already taken steps to protect indoor air quality and you want to understand the bigger picture driving Utah’s chronic air quality challenges, this is where we’d send you next. 🔗https://www.healutah.org/ourwork/cleanair/
Supporting Statistics: What the Research Confirms About Utah’s Air Quality — and What We’ve Seen Firsthand
We talk to Utah homeowners about indoor air quality every day. Most underestimate how serious — and how frequent — the problem actually is. Here’s what the data shows, and what it means for decisions inside your home.
Statistic #1: Salt Lake City Has Ranked 9th Worst in the Nation for Ozone Pollution Two Years Running
The American Lung Association’s 2025 “State of the Air” report confirmed the Salt Lake City-Provo-Orem metro area as the 9th most polluted in the nation for ozone — two years in a row — with Salt Lake County averaging 25.7 unhealthy ozone days annually and earning a federal failing grade.
What we’ve observed firsthand:
- Wildfire smoke is visible — residents react immediately
- Elevated ozone is invisible, odorless, and builds quietly on warm afternoons
- Windows stay open. Kids play outside. Exposure happens without warning.
- Households that check AQI daily are consistently better prepared than those who react after symptoms appear
🔗 American Lung Association — State of the Air 2025 https://www.lung.org/media/press-releases/ut-sota-2025-saltlakecity-release
Statistic #2: Utah Air Pollution Shortens the Average Resident’s Life by Up to 3.6 Years — Across the General Population, Not Just Sensitive Groups
A peer-reviewed study by 23 Utah-based researchers estimated that air pollution causes between 2,500 and 8,000 premature deaths in Utah annually, reducing median life expectancy by 1.1 to 3.6 years — with 75% of Utahns potentially losing at least one year of life and 23% losing five years or more.
What most Utah homeowners get wrong:
- Many assume air quality risk is primarily a concern for children, the elderly, or those with asthma
- This research shows the life expectancy loss is distributed across the general population
- That means the Wasatch Front resident without any preexisting condition is still meaningfully affected
What we recommend based on this data:
- Run home air filtration on inversion days and wildfire smoke events — for every household member, not just vulnerable ones
- Treat high-AQI days as a household-wide health event, not an individual sensitivity concern
🔗 University of Utah — Air Pollution Health and Economic Cost Research https://attheu.utah.edu/facultystaff/air-pollution-costs-utahns-billions-annually-and-shortens-life-expectancy-by-two-years/
Statistic #3: Utah Averages 18 Days Per Year Where PM2.5 Exceeds Federal Safety Limits — and They Stack
The Utah Department of Environmental Quality reports that a typical Utah winter generates five to six multi-day inversion episodes, producing an average of 18 days annually where fine particulate matter exceeds the National Ambient Air Quality Standard — conditions that typically require a major storm system to clear.
What 18 days actually looks like on the ground:
- Inversion episodes rarely arrive as isolated single-day events
- In our field experience, they stack — 3, 4, sometimes 7 consecutive high-AQI days before conditions break
- By day three of a red air day, it’s too late to start looking for filtration solutions
The homes that hold up best during inversion season share three things:
- Filtration already running on a consistent maintenance schedule before inversions lock in
- A MERV 11 or higher-rated filter in place and recently replaced
- A daily AQI check habit established before winter inversion season begins
🔗 Utah Department of Environmental Quality — Inversions https://deq.utah.gov/air-quality/inversions
Final Thought & Opinion: What Utah’s Air Quality Data Means for the Decisions You Make Inside Your Home
Utah’s AQI map tells you what’s happening outside. What it doesn’t tell you is what’s happening inside — and in our experience, that’s where most households are most exposed.
Key Takeaway:
Utah’s air quality challenge is structural, not seasonal.
- Wasatch Front basin geography traps pollutants year after year
- Winter inversions and vehicle emissions repeat the same cycle every cold season
- Checking the live AQI map is the right first step — but real protection requires action inside the home
Our Perspective:
Most air quality conversations focus on outdoor behavior. Those decisions matter. But the bigger gap we’ve identified isn’t awareness of bad air days — it’s the assumption that being indoors automatically means being protected.
It doesn’t.
On high-AQI days:
- Fine particulate matter infiltrates through gaps, ventilation, and poorly maintained ductwork
- A clogged or low-rated air filter provides far less protection than most residents assume
- During a five-day inversion stretch, that protection gap compounds every single hour
From Our Field Experience:
Here’s what we’ve consistently observed across Utah households:
- Residents who check AQI daily make better indoor decisions — windows, filtration, and outdoor activity — across the entire household
- Homes running a MERV 11 or higher filter on a consistent replacement schedule show better indoor air outcomes during inversion season
- Households hit hardest during prolonged inversion episodes almost always treated air filtration as set-it-and-forget-it rather than an active, maintained defense
- Wildfire smoke season and winter inversion season now together cover a significant portion of the Utah calendar year — making air quality a year-round discipline, not a weather event response
Our Belief:
Utah’s rankings aren’t abstract statistics. They are real-world outcomes of a geography and climate that makes air quality genuinely difficult to manage without active attention.
- 9th worst in the nation for ozone pollution
- 18 federal standard exceedance days per year on average
- Up to 8,000 estimated premature deaths annually
Checking the live Utah AQI map is the starting point. Maintaining the filtration system inside your home is what turns that awareness into real protection.
Why It Matters:
The homeowners who navigate Utah’s worst air quality days most effectively share one thing in common. They didn’t wait for conditions to deteriorate before taking action.
They built three simple habits:
- Check the AQI map daily — especially during winter and wildfire season
- Maintain home air filtration on a consistent filter replacement schedule
- Act before inversion conditions lock in — not after day three of a red air day
That’s the perspective we bring to every indoor air quality conversation at CoolingDen. The data is clear. The tools are available. The gap between knowing and doing is where air quality exposure happens most.
FAQ on Live Air Quality Index AQI Map Now Today Utah
Q: What does the live Utah AQI map show me right now?
A: The live Utah AQI map displays real-time Air Quality Index readings from monitoring stations across the state.
Coverage includes:
- Salt Lake City
- Provo
- Ogden
- St. George
- Wasatch Front communities
Key facts about the map:
- Readings are updated continuously throughout the day
- Each color-coded zone reflects current pollution levels in micrograms per cubic meter
- The map measures both PM2.5 and ozone levels simultaneously
What we’ve learned firsthand: The sky can look perfectly blue while PM2.5 levels are already crossing into Unhealthy territory. Checking this map every morning is the single habit that consistently separates prepared Utah households from reactive ones.
Q: What is a safe AQI level in Utah today, and when should I be concerned?
A: “Safe” depends on who’s in your household — not just the number. Here’s how we break it down:
- 0–50 (Green): Safe for everyone — windows open, no filtration changes needed
- 51–100 (Yellow): Moderate — sensitive individuals should limit prolonged outdoor exposure
- 101–150 (Orange): Close windows and check your filter status now
- 151–200 (Red): Run home air filtration for all household members — not just sensitive groups
- 201–300 (Purple): Stay indoors, seal gaps, run HEPA-rated filtration continuously
- 301+ (Maroon): Household health emergency — avoid all outdoor exposure without exception
What we consistently observe: The Orange-to-Red transition is the threshold Utah homeowners underestimate most. By day two of a sustained inversion, homes without a properly maintained filtration system feel the difference significantly.
Q: Why does Utah’s air quality change so dramatically from day to day?
A: Utah’s Wasatch Mountain basin geography creates near-ideal conditions for trapping pollution at ground level — and that trap can close faster than most residents expect.
The three factors driving Utah’s most dramatic day-to-day AQI swings:
- Temperature inversions — cold air trapped beneath warm air, most severe December through February, building without visible warning overnight
- Wildfire smoke events — capable of pushing AQI from Moderate to Very Unhealthy within hours, June through October, from fires hundreds of miles away
- Storm and wind systems — the primary natural mechanism that breaks inversions and resets AQI readings
What we’ve seen firsthand:
- AQI readings can be acceptable at 8 a.m. and cross into Unhealthy before noon
- Inversions build overnight while conditions appear normal
- A live AQI map checked daily is more reliable than any weekly forecast
Q: How does today’s outdoor Utah AQI affect the air quality inside my home?
A: More directly than most Utah homeowners expect.
The common assumption we encounter: Closing windows on a bad air day is enough protection. It isn’t.
Why indoor air is still at risk on high-AQI days:
- Fine particulate matter infiltrates through gaps around doors and windows
- Poorly sealed or unmaintained ductwork allows PM2.5 to enter directly
- Indoor PM2.5 levels can climb to a meaningful fraction of outdoor levels — even with windows sealed
What today’s Utah AQI should trigger inside your home:
- Orange or below: Verify filter is clean and within replacement window
- Red: Close windows, run HVAC with MERV 11 or higher filter, avoid candles, gas stoves, and frying indoors
- Purple or Maroon: Run HEPA-rated filtration continuously, seal door and window gaps, turn exhaust fans off — they pull contaminated outdoor air directly inside
Bottom line: The homes with the best indoor air quality during Utah’s worst AQI days aren’t the most expensively equipped. They’re the ones where filtration is already serviced and running before the inversion peaks.
Q: When are Utah’s worst air quality days, and how do I stay ahead of them?
A: Utah has two distinct high-risk seasons. Both catch residents off guard — for different reasons.
Winter inversion season (November through February):
- Utah averages 5 to 6 multi-day inversion episodes per winter
- Average of 18 days annually where PM2.5 exceeds federal safety standards
- Episodes stack — 3, 4, sometimes 7 consecutive high-AQI days before conditions clear
- By the time most households react, multi-day exposure has already accumulated
Wildfire smoke season (June through October):
- In-state and regional fires from California, Oregon, Idaho, and Nevada push smoke into Utah with little warning
- AQI can spike from Moderate to Hazardous within hours
- Source fires can be hundreds of miles away with no visible smoke on the horizon
How to stay ahead of both seasons — what consistently works:
- Check the live Utah AQI map every morning — before opening windows or committing to outdoor plans
- Replace your home air filter at the start of each high-risk season — November for inversion season, June for wildfire season
- Sign up for Utah DEQ air quality alerts at air.utah.gov — so deteriorating conditions reach you before you discover them
- Run HVAC filtration proactively on forecasted high-AQI days — not reactively after conditions peak and the exposure window has already been open for hours
The gap we see most often: Knowing Utah has bad air days — but not being prepared when they arrive. Closing that gap starts with the live AQI map and follows through to the filtration system running inside your home right now.
Now That You Know How to Read Utah’s Live Air Quality Index AQI Map Today, It’s Time to Protect the Air Inside Your Home
Visit CoolingDen.com for expert guidance on air filtration systems, MERV filter ratings, and the HVAC maintenance steps that keep your household protected on Utah’s worst AQI days — backed by real field experience helping homeowners breathe cleaner air year-round.